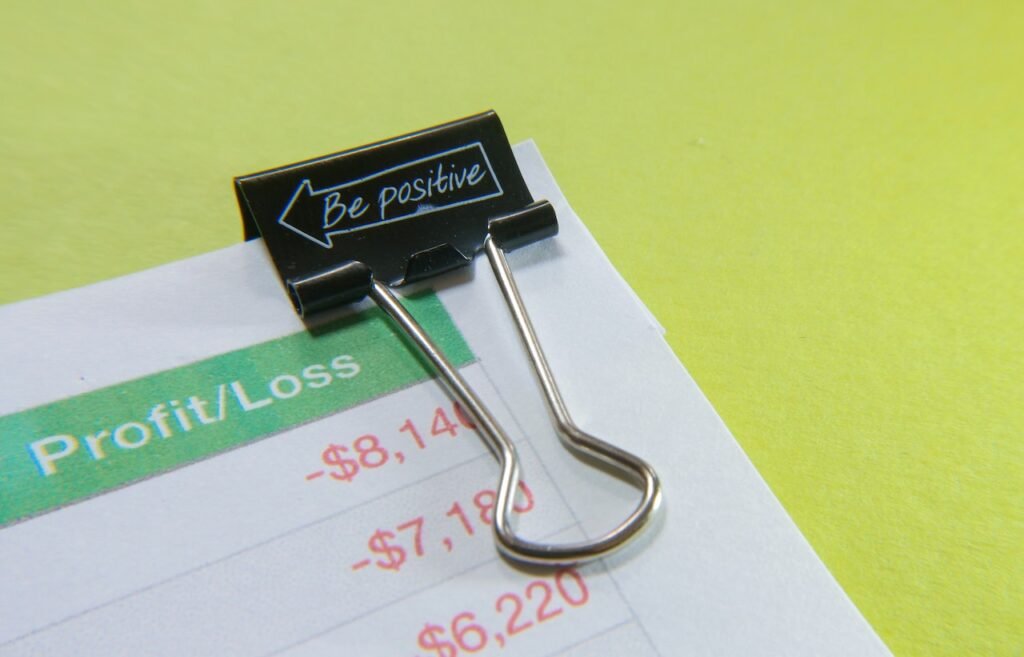
Two of the most important financial statements for a business are the Profit and Loss Account, and the Balance Sheet. The Profit and Loss Account shows the profit or loss of a business over a given period of time e.g. 3 months, 1 year, etc.
In contrast, the Balance Sheet is like a photograph taken at an instant in time giving a picture of what the business owns and what the business owes at that moment in time. As we shall see it will always balance because what the business owns is financed by what the business owes.
The Profit and Loss (P&L; account)
One of the most important objectives of a business is to make a profit. The P&L; account shows the extent to which it has been successful in achieving this objective.
Companies are expected to keep their P&L; accounts in certain formats.
Typically the P&L; account will show the revenues received by a business and the costs involved in generating that revenue.
In simple terms:
Revenues – Costs = Profits.
In a typical P&L; the account will look like the following:
Case Study:
P&L; Account for Superior Traders as at 31/12/2004
You can find out the gross profit of a business by deducting the cost of sales from turnover:
£100,000 – £50,000 = £50,000
You can find out the operating profit by deducting the expenses from the gross profit:
£50,000 – £30,000 = £20,000
You may also come across the term net profit. Operating profit is earned from carrying out a business’s normal operations e.g. producing confectionery, or selling Christmas cards.
Net profit takes account of other sources of income and expenditure that are not involved in normal operations e.g. interest paid on loans and interest received on having a positive balance in a bank account.
Turnover – is the value of sales made in a trading period. It is sometimes referred to as sale revenue and is calculated by the average price of items sold x the number sold.
Cost of sales – calculates the direct costs of manufacturing items, or buying in items to sell them on.
Expenses – are the overhead costs of running a business. These overheads can’t be tied down to particular cost units. For example, it would be very difficult to calculate what fraction of the heating cost of a pen factory can be allocated to just one pen.
The Balance Sheet is a statement showing the assets, liabilities and owner’s capital of a business at a particular moment in time, for example, the year-end.
The Balance Sheet balances because the assets that a business possesses at a specific time have been financed either through the provision of capital by the owners or by the creation of external liabilities:
Value of assets = Value of Liabilities Value of Owner’s capital.
There are a number of things that we can see from looking at a balance sheet, for example:
- The Net Assets of the business, i.e. the difference between the value of the assets and the value of the liabilities. Growth in net assets tends to indicate a growing business.
- How solvent the business is. In other words, does it have enough assets that are short-term, and hence easily converted into cash, to pay any pressing short-term liabilities?
Case Example: A typical balance sheet will be set out in the following way (note that we use two columns. The first column is for minor calculations, and the second column is for grand totals):
Balance Sheet of Superior Traders, as of 31st December 2004
Fixed assets consist of those items that are kept within the business to create wealth over a period of time e.g. machinery, equipment, vehicles, computers, etc.
Current assets are used in a short period to generate income for a business. For example, in a manufacturing company like Kraft, stocks would represent products that have already been made and are waiting to be sold to retailers.
Typically stocks will be sold on credit for periods of one month, two months, or three months. Retailers buying stocks on credit from Kraft would become Kraft’s debtors. At the end of the credit period, they will pay up in the form of cash, enabling Kraft to buy more raw materials to create further stocks.
Creditors due within one year are the sums that a business owes money to in a short period – otherwise known as current liabilities.
Net current assets are a measure of how solvent or liquid a business is.
Many businesses need to have working capital. Working capital is calculated by subtracting current liabilities from current assets:
Working capital = Current assets – Current liabilities
Note that the figure for net current assets appears almost in the centre of a balance sheet, and is a figure that many people will look at first to check on the solvency of a business.
Total assets – current liabilities are a sum that appears in the balance sheet simply doing what the title suggests.
Creditors due after more than one year show the longer-term liabilities of the business.
Total net assets are calculated by taking away all the liabilities (both current and long term) from all of the assets (both current and long term).
Shareholders’ funds show the value of the shareholder’s capital in the business. It will always be the same value as the total net assets and it balances the account.
