
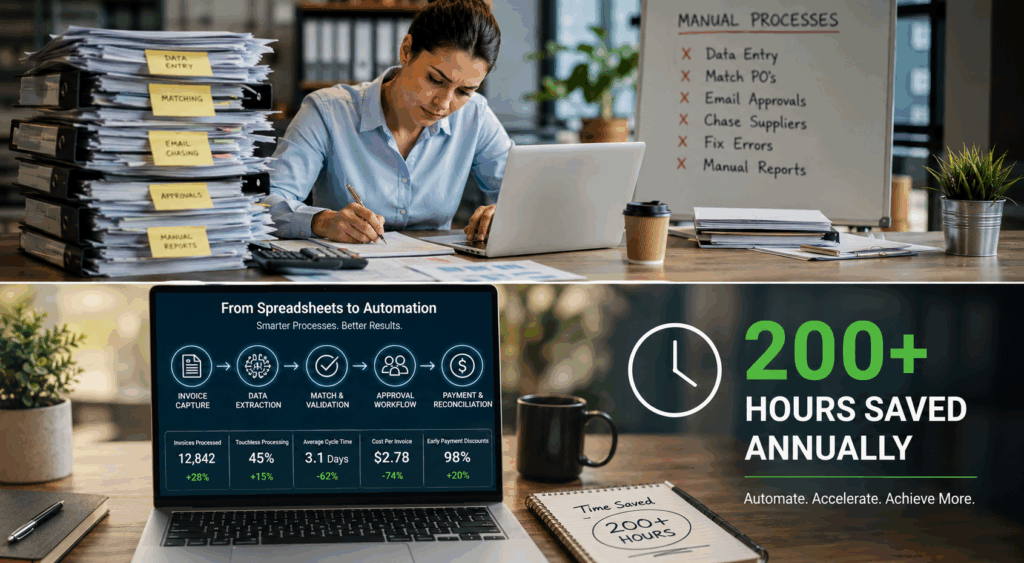
Ask a Finance Director where their team’s time goes, and the honest answer is rarely flattering. Despite two decades of investment in ERP systems and cloud accounting, a substantial share of the working week in many finance functions is still consumed by keying invoice data, chasing approvals by email, matching documents line by line, and answering suppliers who want to know when they will be paid. Accounts payable, the most transactional corner of the finance department, remains the most manual, and the cost of that inertia is now well documented. Industry benchmarks suggest that a typical mid-sized finance team loses well over 200 hours a year to repetitive AP tasks that software can handle faster, more cheaply, and with fewer errors.
The scale of the problem has been quantified with unusual rigour, and so has the response to it. A maturing market of platforms dedicated to accounts payable automation has grown up precisely because the gap between manual and automated performance is now too large for finance leaders to ignore. Ardent Partners, whose annual State of ePayables research is the most widely cited benchmark in the field, estimates that around 75% of AP departments worldwide now use some form of automation, yet full end-to-end adoption remains the exception rather than the rule. The organisations that have crossed that threshold are operating on fundamentally different economics from those still running the process by hand.
The measurable cost of manual accounts payable
Start with the headline figures. According to Ardent Partners’ 2025 benchmarks, the average fully loaded cost of processing a single invoice is $10.89, once labour, overheads, error correction and infrastructure are accounted for. Best-in-class organisations, defined by their level of automation, process the same invoice for $2.78, a reduction of roughly 74%. APQC’s benchmarking data tells the same story from a different angle, with median performers spending more than twice as much per invoice as top-quartile organisations, a gap that correlates far more strongly with automation maturity than with wage levels or headcount.
Time follows the same pattern. The average invoice takes 10.9 days to travel from receipt to approval, while best-in-class automated teams complete the cycle in 3.1 days. For organisations with predominantly manual workflows, the picture is worse still: earlier Ardent Partners research put the unautomated average at 17.4 days per invoice. Nearly three working weeks for a routine administrative task is not a rounding error. It is a structural drag on cash management, on supplier goodwill, and on the finance team’s capacity to do anything else.
These are the visible manual AP process costs. The hidden ones compound them. Levvel Research and IOFM benchmarks estimate that manual keying introduces errors into between 1% and 4% of invoices, each of which generates downstream correction work in the ERP, payment discrepancies to trace, and vendor statements to reconcile. Ardent Partners also reports that organisations running manual workflows capture only 20% to 30% of the early payment discounts available to them, simply because invoices cannot clear approval in time. On a meaningful payables base, the discounts left on the table alone can exceed the entire cost of an automation programme.
Where the hours actually go
To understand why the gap is so wide, it helps to break a manual invoice journey into its component tasks, because none of them is individually dramatic. The waste hides in the aggregate.
Data entry and document handling
Invoices arrive by email, post and supplier portal in inconsistent formats. Someone opens each one, extracts the header and line-item data, and keys it into the accounting system. IOFM benchmarking suggests an experienced AP clerk working manually processes between 25 and 40 invoices per day. At the midpoint, that is roughly a quarter of an hour of skilled attention per document, spent on transcription.
Matching and approval routing
Each invoice must then be matched against a purchase order and, where relevant, a goods receipt, before being routed to the right approver. In manual environments, this routing happens by email, and approvals stall in inboxes. The approver is travelling, the delegation rules are unclear, or the invoice simply sits unread. Much of the 10.9-day average cycle time is not processing at all. It is waiting.
Exception handling and supplier queries
Ardent Partners puts the average invoice exception rate at 14%, against 9% for best-in-class teams. Every exception, whether a price mismatch, a missing PO or a duplicate, demands investigation, correspondence and rework. Meanwhile, suppliers who cannot see the status of their invoices phone and email to ask, and answering them becomes an unbudgeted job in its own right. Surveys of AP professionals consistently rank supplier enquiries among the most time-consuming and least rewarding parts of the role.
Testing the 200-hour claim
The figure in this article’s title deserves scrutiny rather than acceptance, so consider the arithmetic. Take a finance team processing a modest 500 invoices per month. At a conservative ten minutes of cumulative hands-on time per invoice across capture, keying, matching, routing and filing, that is roughly 83 hours of touch time per month, or around 1,000 hours per year devoted purely to invoice mechanics, before a single exception or supplier call is counted.
Automation does not eliminate all of that time, and honest analysis should not pretend it does. But the benchmarks show what it removes. Best-in-class organisations now achieve straight-through, touchless processing on 35% or more of their invoice volume, with leaders reaching close to half, meaning those invoices flow from receipt to approval without any human keystrokes. Handling time on the remainder falls sharply because data capture, matching and routing are done by the system, leaving humans to review rather than transcribe. If automation removes even a quarter of that 1,000-hour burden, the saving is 250 hours a year. In practice, organisations that automate end to end routinely report reductions far beyond that. The 200-hour figure is not a stretch target. For most mid-sized teams it is a conservative floor, equivalent to little more than four reclaimed hours per week.
A worked example: before and after automation
Numbers become more useful when attached to a recognisable organisation, so consider an illustrative finance automation case study built on figures consistent with the published benchmarks. A mid-sized UK distribution business processes around 700 supplier invoices a month through a two-person AP function. Before automation, its metrics sit close to the industry averages: a fully loaded cost of roughly £8.50 per invoice, a 12-day approval cycle, a 15% exception rate, and early payment discounts captured on fewer than a quarter of eligible invoices. Both AP staff spend the majority of their week on data entry and approval chasing, and month-end close regularly slips because accruals depend on invoices still sitting in inboxes.
Twelve months after implementing an automated invoice processing platform, the picture has changed in every dimension that matters. Around 65% of invoices now process touchlessly, captured, matched and routed without human intervention. The approval cycle has fallen to four days, lifting discount capture above 75% of eligible spend. The exception rate has halved, because validation rules catch mismatches at the point of capture instead of after posting. Per-invoice cost has dropped below £3.50, and the team recovers approximately 20 hours per week of combined capacity, which annualises to more than 1,000 hours. Critically, neither role was made redundant. One team member now owns supplier relationship management and statement reconciliation, while the other supports the financial controller on spend analysis and cash forecasting, work that the business previously had no bandwidth to do at all.
Measuring automation ROI properly
Finance leaders are rightly sceptical of vendor arithmetic, so it is worth being precise about how automation ROI should be assessed. The direct saving is the per-invoice cost differential multiplied by annual volume, which for the example above is worth around £42,000 a year. But three further lines belong in any honest model. First, discount capture: the difference between capturing 25% and 75% of available early payment discounts on a few million pounds of annual payables is frequently a five-figure sum on its own. Second, error and fraud reduction: automated three-way matching and duplicate detection remove a category of leakage that manual controls catch inconsistently. Third, and hardest to price, is the value of the redeployed time itself, which depends entirely on what leadership chooses to do with it.
That last point separates organisations that get lasting value from automation from those that simply run a cheaper version of the old process. Invoice processing efficiency is the mechanism, not the objective. The objective is a finance function with the capacity to influence decisions rather than record them.
What high-performing teams do with the time
The research on this is consistent: organisations that treat AP automation as a finance process optimisation programme, rather than a cost-cutting exercise, redirect the recovered hours into three areas.
Data analysis and decision support
AP data is one of the richest datasets a business owns, covering who it buys from, at what price, on what terms, and how those patterns move over time. Automated platforms make this data structured and current, and teams freed from keying can actually interrogate it: identifying maverick spend, consolidating suppliers, benchmarking prices and feeding sharper numbers into cash forecasts. Gartner’s finance surveys show adoption of AI-assisted analysis in finance functions climbing steeply year on year, and transaction-level payables data is where much of that analysis starts.
Vendor relationship management
When suppliers are paid accurately and on time, and can see invoice status without phoning, the relationship changes character. Conversations shift from chasing payments to negotiating terms, volume pricing and service levels. Several benchmark studies note that supplier satisfaction improves measurably after automation, and procurement teams inherit a stronger negotiating position as a direct result.
Strategic initiatives and team development
There is also a workforce argument that finance leaders ignore at their cost. Repetitive transcription work correlates with low engagement and high turnover in AP roles, and recruitment into transactional finance positions has become progressively harder. Teams that automate report improved retention and find it easier to attract candidates, because the roles on offer involve analysis, systems ownership and supplier management rather than data entry. Finance team productivity, in other words, is not only about output per hour. It is about building roles that capable people want to stay in.
Common pitfalls when moving off spreadsheets
The benchmark data also carries warnings, because not every automation programme delivers best-in-class results, and the reasons for underperformance are well understood. The most common is automating a broken process. If approval hierarchies are ambiguous, supplier master data is dirty, or purchase orders are raised after the invoice arrives, the software will route the chaos faster rather than remove it. High-performing implementations begin with a short process review, cleansing supplier records and tightening PO discipline before the platform goes live.
The second pitfall is treating approvers as outside the project. Automation moves the bottleneck rather than eliminating it if budget holders continue to sit on approval requests, so successful teams set service-level expectations for approvers, build escalation rules into the workflow, and publish approval cycle times on a dashboard where everyone can see them. The third is measuring the wrong things after go-live. Headcount reduction is the metric vendors’ critics reach for, but the organisations extracting the most value track touchless processing rate, exception rate, cycle time and discount capture, and manage the recovered hours as deliberately as they would manage any other newly available resource. A time-saving invoice automation project that never decides where the saved time should go has, in a meaningful sense, not finished.
Finally, finance leaders should be realistic about the adoption curve. Touchless rates build over months as the system learns supplier formats and exception rules are refined. The worked example above reached 65% touchless processing after a year, not a fortnight, and setting that expectation early protects the project’s credibility while the gains compound.
Conclusion: the spreadsheet era is ending on the evidence, not the hype
The case for automating accounts payable no longer rests on projections. It rests on a decade of accumulated benchmark data showing a stable, repeatable pattern: per-invoice costs falling by around three quarters, cycle times compressing from weeks to days, exception rates halving, and hundreds of staff hours a year moving from transcription to work that changes business outcomes. The AP automation benefits are, by the standards of finance technology investments, unusually easy to verify and unusually quick to arrive, with most implementations measured in weeks rather than years.
For finance leaders still running the process through spreadsheets and inboxes, the practical starting point is measurement: calculate the current fully loaded cost per invoice, the true cycle time, and the hours the team spends on capture, matching and chasing. Set those figures against the published benchmarks. If the gap looks anything like the industry averages suggest it will, the 200 hours in this article’s title will turn out to be the beginning of the story rather than the end of it.