
The relative strength index, commonly abbreviated as (RSI) is a momentum indicator which measures the speed and change of movements in prices. It oscillates somewhere between zero and 100. According to the developer, J. Welles Wilder, RSI above 70 is overbought and when it is below 30, oversold. One can generate signals by monitoring the divergences, centerline crossovers and failure swings. Financial analysts can also use the relative strength index to identify the general trend. Most investors use the RSI simply by buying securities when the indicator shows 30 and selling when it gets to 70.
The RSI default look-back period is usually 14, but one can lower it to increase sensitivity or raise it to decrease the sensitivity. Parameters also depend on the volatility of the security. Here are some strategies investors can use with relative strength index.
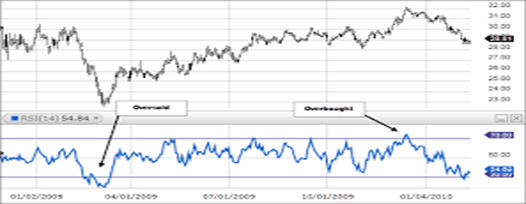
- RSI OBOS levels
As mentioned before, RSI above 70 is overbought and may signal that the price may decline soon. If it is below 30, it shows that is oversold and may indicate that the price may go down. The 50 level denotes the midline that separates the bullish and bearish territories.
- RSI two-period divergence
When you apply a short 5-period RSI over the default 14-period RSI, there are crossovers. With the default setting, there are times when the market does not reach the oversold or overbought lines before there is a shift in direction. A relative strength index with a shorter period is more sensitive to changes in price; therefore, it will show early reversal signs. When the 5-period RSI crosses above the default, it signals that the prices are getting higher.
- RSI Trend-lines
To trade the trend-line break, connect the tops and bottoms on the RSI chart itself. To draw an uptrend line, connect three points or more on the RSI line as it goes up. For the downtrend line, connect three or more points on the RSI line as it goes down. The break of the RSI trend-line precedes the break of the same on the price chart providing an early warning and opportunity to open a trading position.
- RSI Classic Divergence
Bearish divergences come about when the price forms a high, and at the same time, the RSI goes down forming a lower high. The RSI divergence forms at the top of the bullish market and are commonly known as the reversal pattern. Investors anticipate the reversal when the relative strength index forms. It is an early reversal warning appearing in several candlesticks before the trend changes direction and breaks below the support line. Contrariwise, the bullish divergence occurs when the price forms a new low and RSI forms a higher low. It is an early warning that the trend will shift from a downward trend to an upward trend.
In conclusion, relative strength indicator is widely misused in MT4 because even novice traders can find their way around trading with it. If correctly understood and applied, a trader can speculate whether prices are trending and in turn, know the best price to open or close a trading position.