By law companies are expected to produce financial statements each year. These statements appear in Company Reports.
There are two main financial statements:
1.The profit and loss account, and
2.The balance sheet.
The profit and loss (P&L;) account
This account can be updated regularly and shows how much profit or loss a business is making. A profit can be made in several ways, for example:
- from trading, in the case of a High Street shop, i.e. buying and selling items such as clothes and furniture
- from manufacturing, for example a company like Kraft produces chocolate bars and other foodstuffs. It buys in raw materials such as cocoa and sugar which it processes to make chocolate.
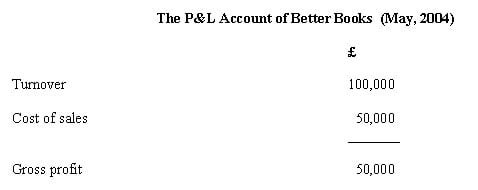
The top section of a P&L; account is known as the trading account for a business that buys and sells items e.g. a bookshop. What is known as the gross profit is calculated by deducting cost of sales from turnover.
For example:

Turnover
Sometimes referred to as sales revenue and is calculated by multiplying the number of items
sold by their average price.
For example if the average price of a book is £10.
The number of books sold is 10,000.
The turnover is therefore.
10,000 x £10 = £100,000
Cost of sales
The cost of buying in the items to trade them. In this case the cost of buying the books. For example, the bookshop may buy in books at an average cost of £5 each.
Assuming that it has bought in 1,000 books.
Cost of sales is therefore.
10,000 x £5 = £50,000
Gross profit is calculated by deducting cost of sales from turnover.
Gross profit
Is therefore.
£100,000 – £50,000 = £50,000
We now need to examine the next part of the P&L; account.
As well as the cost of sales, a business will incur overhead costs. These costs can not directly be related to each unit of output made or sold – hence the name overheads.
Overheads
typically referred to asexpenses in the P&L; account. Typical expenses for a business include items such as heating and lighting costs, as well as insurance and advertising. General administrative costs of running a business appear as administrative expenses.
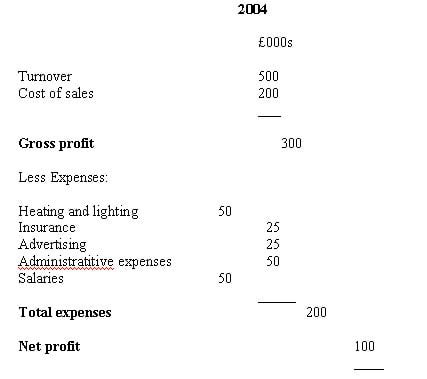
We can now set out a P&L; account in the following way:
The P&L; account of Superior Traders as at 31 December:

The net profit of the business is calculated by deducting the expenses from the gross profit figure.
Turnover – Cost of Sales = Gross Profit
Gross Profit – Expenses = Net Profit
Assets
Is like a snapshot taken at a particular moment in time giving a summary of the overall financial position of a business.
Businesses need to use assets in order to generate wealth.Assets are the things that a business owns or sums that are owed to the business at any one moment in time.
The business obtains the finance for these assets from two main source:
1.Internally (inside the business) from capital raised from the business owners (the shareholders in the case of a company).
2.Externally – for example, in the form of loans, and other forms of finance which will need to be repaid. When you set up a business, the business become a legal body in its own right. Internal finance (shareholders’ funds) is owed to shareholders.
External finance
Is owed to people outside the business – liabilities.
The Balance Sheet will therefore balance because,
Assets = Owner’s capital
Liabilities
In simple terms this shows that the value of a businesses assets is financed by the two groups – 1.Internal (owner’s capital), 2.External (liabilities).
Balance sheet
A balance sheet typically appears in a vertical format.
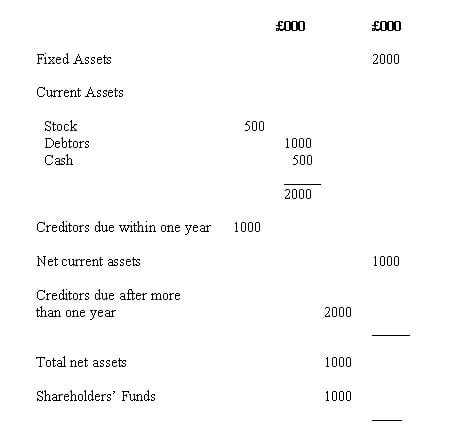
The balance sheet starts off by listing all the assets. Next, come the liabilities. Finally, the owners’ capital is shown – to balance the balance sheet. This is what a typical Balance Sheet looks like. The components of the Balance Sheet are explained below:
The Balance Sheet of Superior Traders on the 31st December, 2004

What does the balance sheet show?
1.The fixed assets show assets that will be kept in the business to generate wealth for the company over a period of time e.g. machines, computers and buildings.
2.In contrast, the current assets, are turned into cash in the short period. For example, a
trading company will buy stock, which it then sells on credit. When the debtors pay up, they will pay in cash. This cash can then be used to buy more stock.
3.Creditors due within one year, shows the short term liabilities of the business, i.e. money that the company must pay within the next twelve months.
4.Net current assets shows the current assets minus the current liabilities. It is important to have enough current assets (money coming in in the short period) to pay short term creditors (short term liabilities). In the example shown the current assets are £2,000 and the current liabilities are £1,000. Therefore net current assets = £1,000.
5.Creditors due after more than one year are the longer term liabilities of the business, for example long term bank loans and mortgage repayments.
6.The total net assets of the business is calculated by taking away all the liabilities (short and long term) from all of the assets (short and long term). Total net assets = (Fixed assets Current assets) – (Current liabilities long-term liabilities).
7.Finally the Balance Sheet is balanced. The Total Net Assets figure is £1000 (ie assets are greater than liabilities by £1000). The assets that are not financed by external liabilities are financed by the owners – therefore the owners’ capital is £1000.
